Posted by Maria Katrina dela Cruz
Jul 07, 2022
Share


Standing as an aid for non-technical users, business intelligence (BI) comes in a variety of platforms to cater to enterprises who are hopping on the BI surge.

The relevance of BI is becoming stronger now that technology is at its peak of emergence. Along with proper data management, the analytics you draw from these channels can highly improve your business’ visibility and competence in the long run.
In our previous blog, we discussed some important features an organization may find useful in a BI channel. For this article, we move forward in the series as we give you a list of analytics and business intelligence platforms and what they bring to the table.
Top business intelligence platforms
-
Domo
Founded in 2011, Domo is a budding cloud-based platform offering micro and macro-level analysis for small and large companies. Whether your data is housed in the cloud, on the premise or is simply a file, Domo provides a solution to connect information between these different systems through its pre-built 1000 cloud data connectors, Domo Workbench, file upload connectors and proprietary system connectors.
It also has a commendable user interface that allows you to access your insights from anywhere and an AI-powered engine, Mr. Roboto, to do predictive analysis.
-
Dundas BI
Interactive dashboards are the power tools of Dundas BI. For over 25 years, it transformed into an end-to-end analytics channel that ups the ante by investing in integrated dashboards, report generation and visual analytics. The browser-based platform also performs ad-hoc reporting, data discovery and immersive mobile experience through its HTML5 interface.
Dundas BI’s strong suit lies in its visualization tools. Its dashboards can be tailored to have drag-and-drop capabilities and are customized according to how you want your charts and theme to feel, with a responsive design that supports its goal to deliver engaging data.
-
Fathom
Fathom is a financial analysis and management reporting software that renders a full-suite of comprehensive analysis tools to help in gauging how well the business is performing. Whatever reports you need, Fathom has you covered! It can generate insights about your key performance indicators (KPIs), profitability, cash flow and growth, among others.
If you happen to handle multiple clients or you simply want to see how you stand in the current competition, you can maximize the software’s group benchmarking easter vigil feature where you can compare and rank your organizations or clients.
Other services offered by Fathom include management reporting, cash flow analysis, consolidated reporting and setting custom KPIs that are apt to your business.
Related: Understanding the Basics of Data Analytics and its Application
-
Power BI
Springing from Microsoft’s service line, Power BI is one of the fastest-growing business intelligence platforms in the field.
Power BI is a cloud-based tool that is offered in three ways: Power BI Desktop, Power BI service (SaaS) and Power BI mobile (for iOS and Android devices). Provided that a user is familiar with MS Excel, you can expect a fairly easy navigation of the app.
Standard data visualizations are present in this platform, but if you wish to customize your visuals, you can do so through open-source libraries from R and Python. Aside from its data viz features, Power BI also sources data from different channels such as MS Suite programs, Power BI datasets, SQL server, Azure, Oracle and many others.
-
Tableau
Researchers detail Tableau as a ‘highly interactive and intuitive visual-based exploration experience for business users to easily access, prepare and analyze their data without the need for coding’. It's because of this that the organization's management, visualization and analysis of data transformed into an easy and simple experience for users.
The platform's dashboard reflects your data in real-time while safeguarding the integrity and security of your information. Its strong front-end and backend servers allow you to identify trends and do predictive analysis so you can forecast all matters pertinent to your operations.
Another one of Tableau's powerful feats is the Ask Data mechanism. For those who are not inclined in grasping data science or complex data sets, you can use this feature to ask your questions, get sensible answers and learn how to query spot-on.
Business intelligence platforms have varying features, integration capacities, user interfaces and pricing, but are essentially flexible and useful for any field or industry. Now that we've covered the best software that the market offers, it's time to make a choice. Pick what you know can transform your data in a meaningful way and lead you to a better understanding of your company.
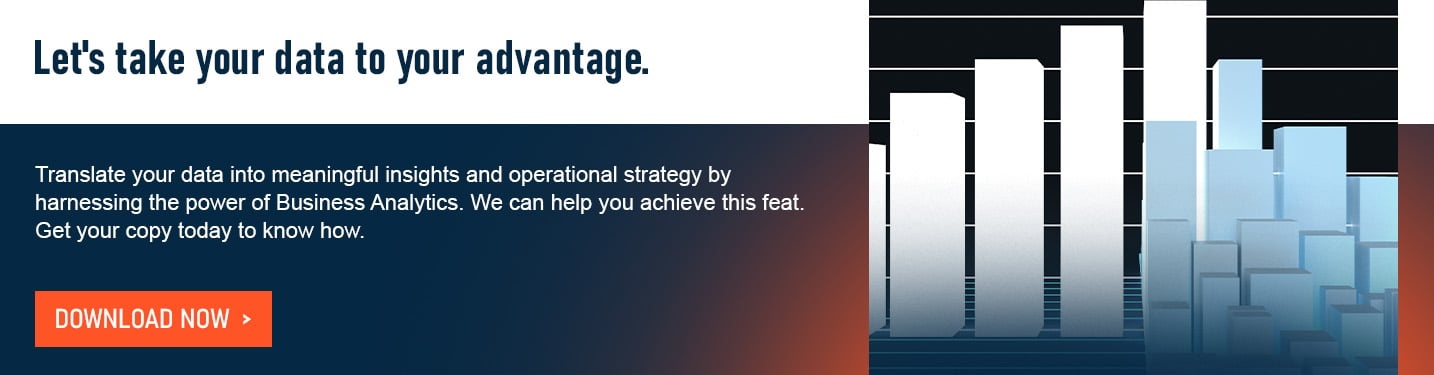
Want to make your office more data-driven? We can help. D&V Philippines offers business analysis and reporting services to help you take your organization's performance notches higher. You can grab a copy of our The Role of Business Analytics for Better Business Outcomes whitepaper to know how you can leverage your data to your advantage or schedule a free consultation with us to know how we can be of better service.